What the report actually looks like
Every section, and why it's there.
A complete sample report
A genuine AiAppraisal valuation, page for page — value conclusion, comparable sales, the full adjustment grid, a comps map and the photo addendum. Only the identifying addresses have been changed.
Download the full PDF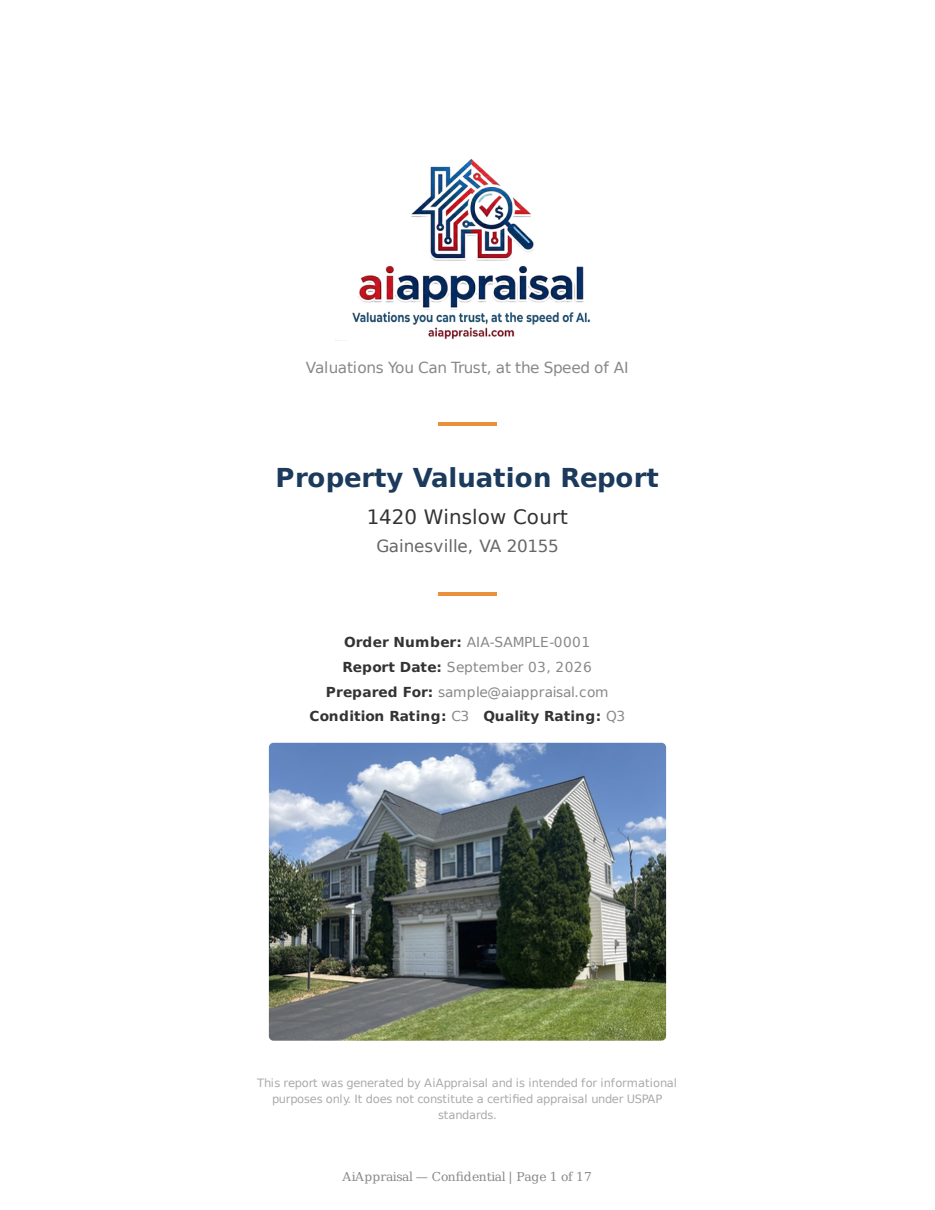
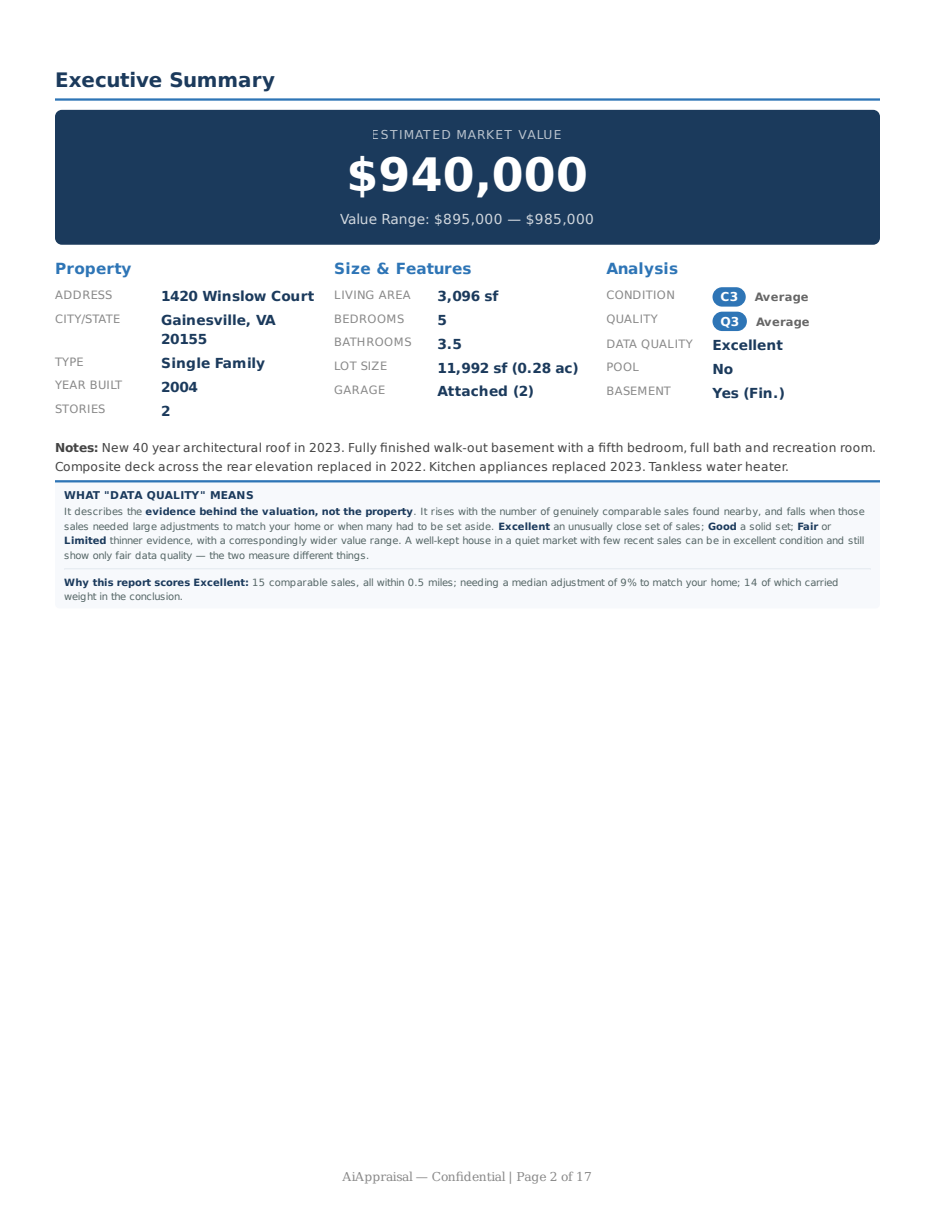
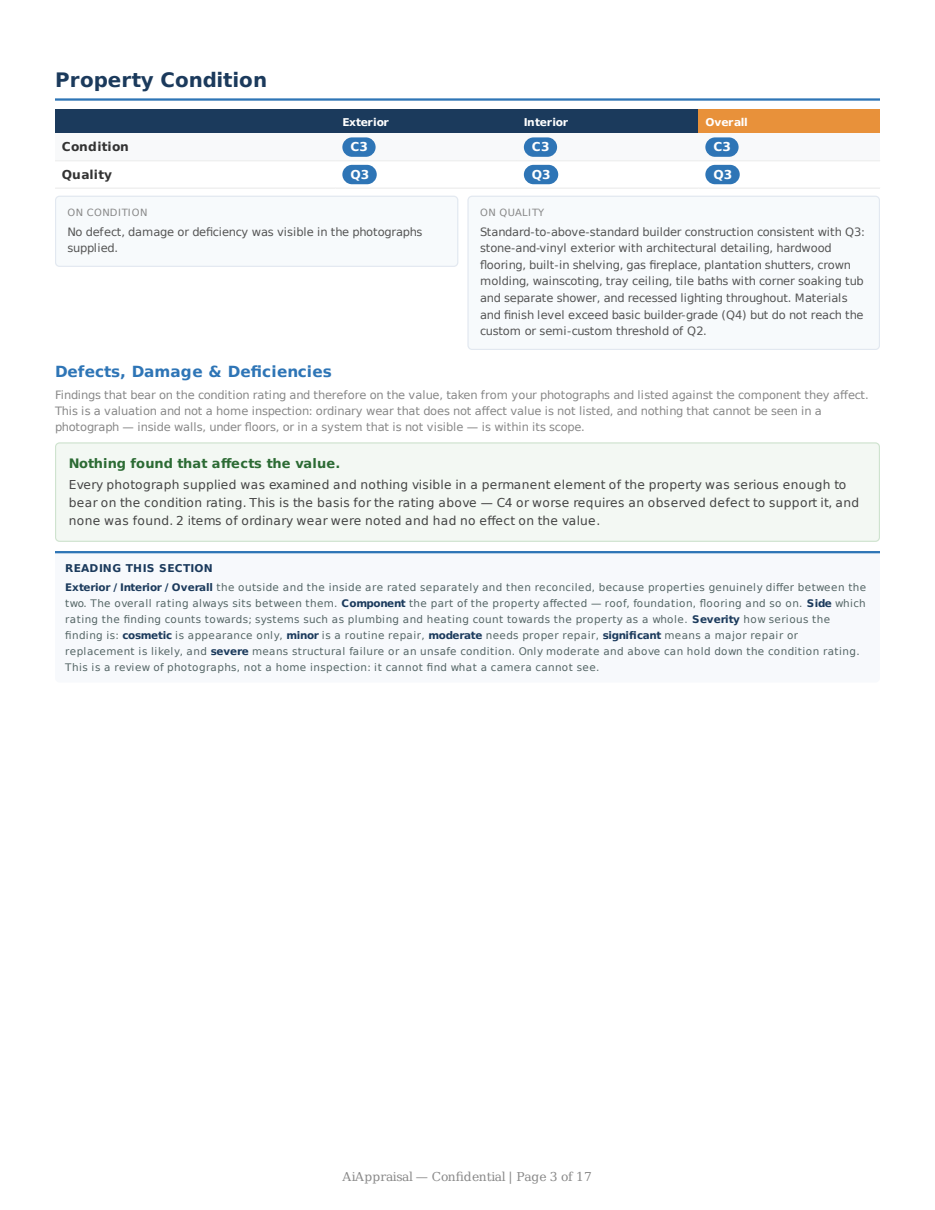
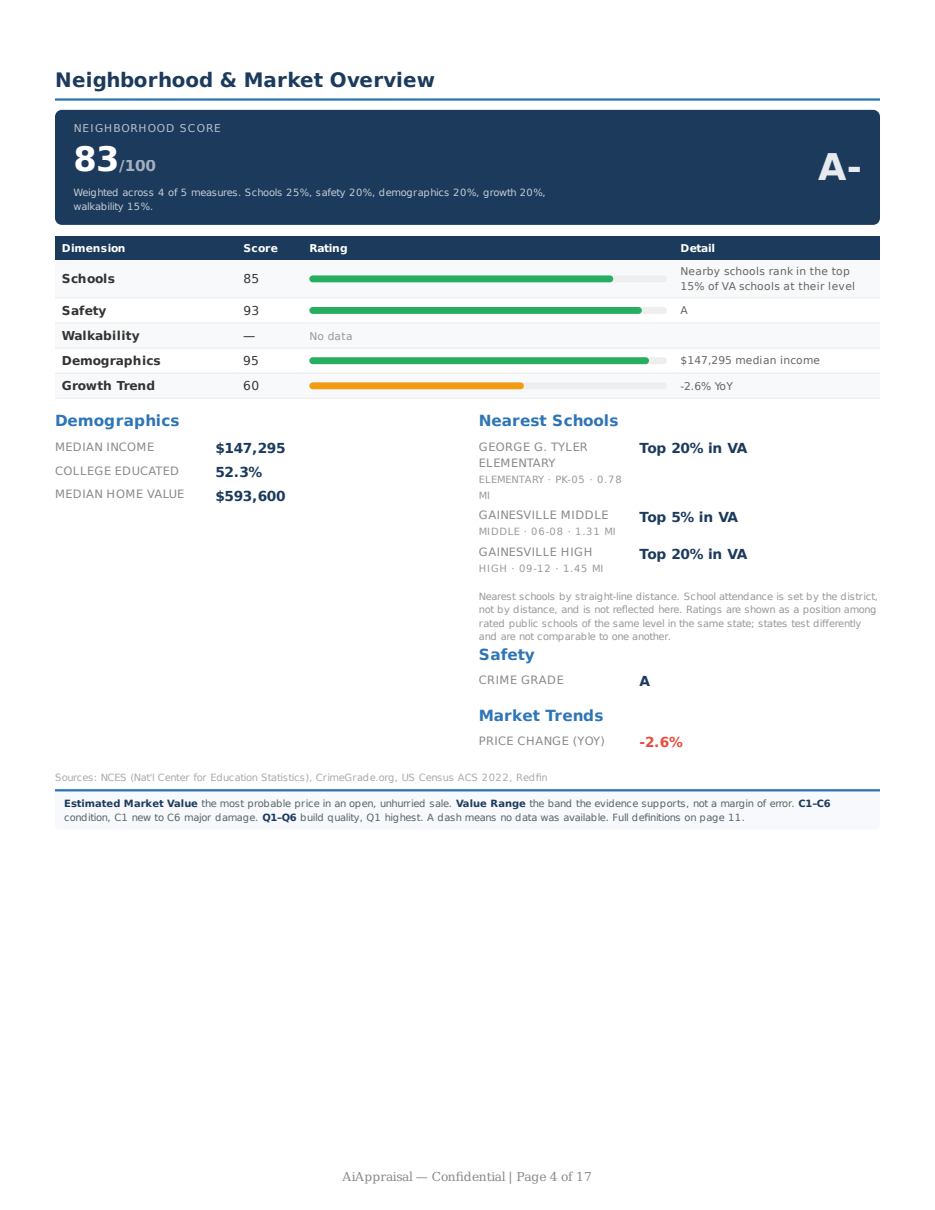

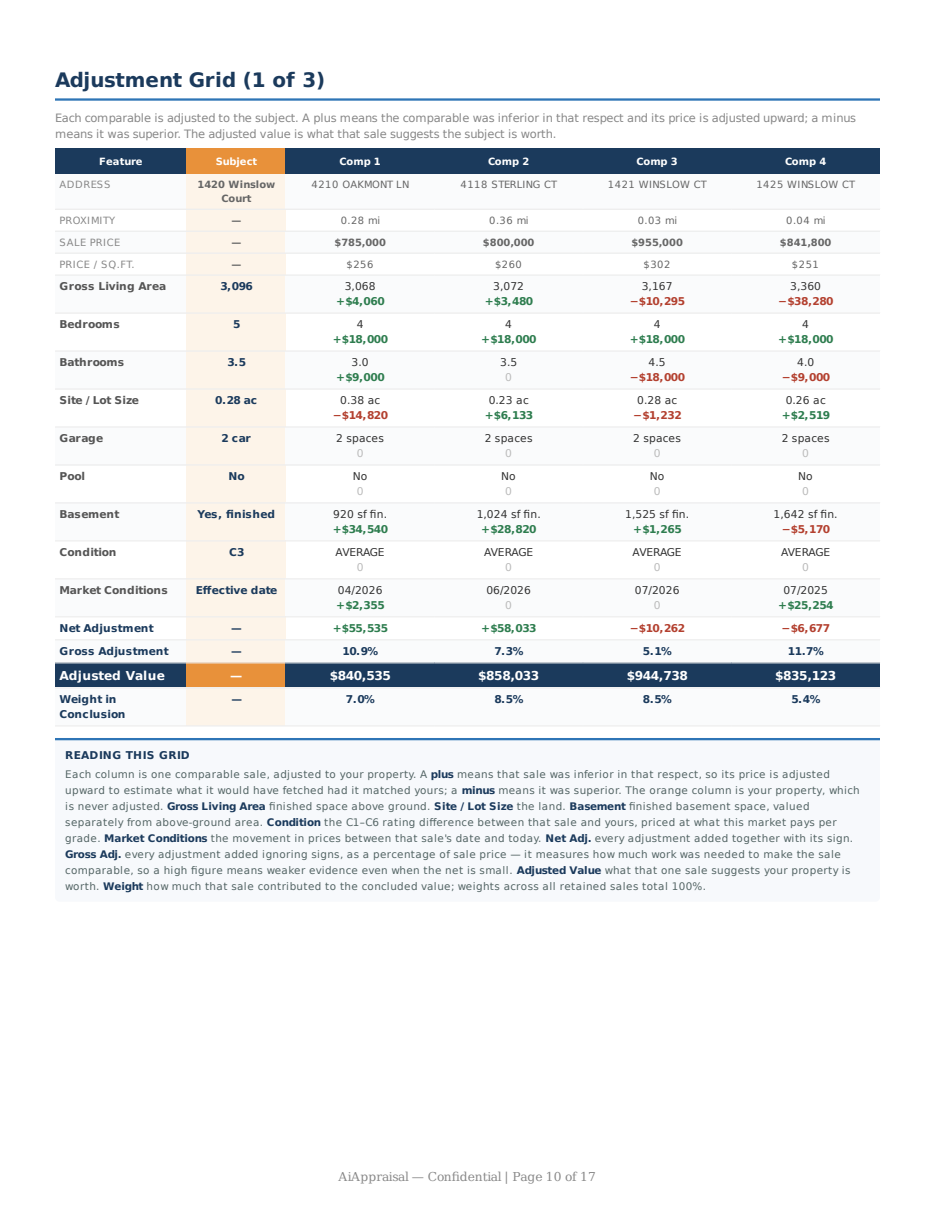
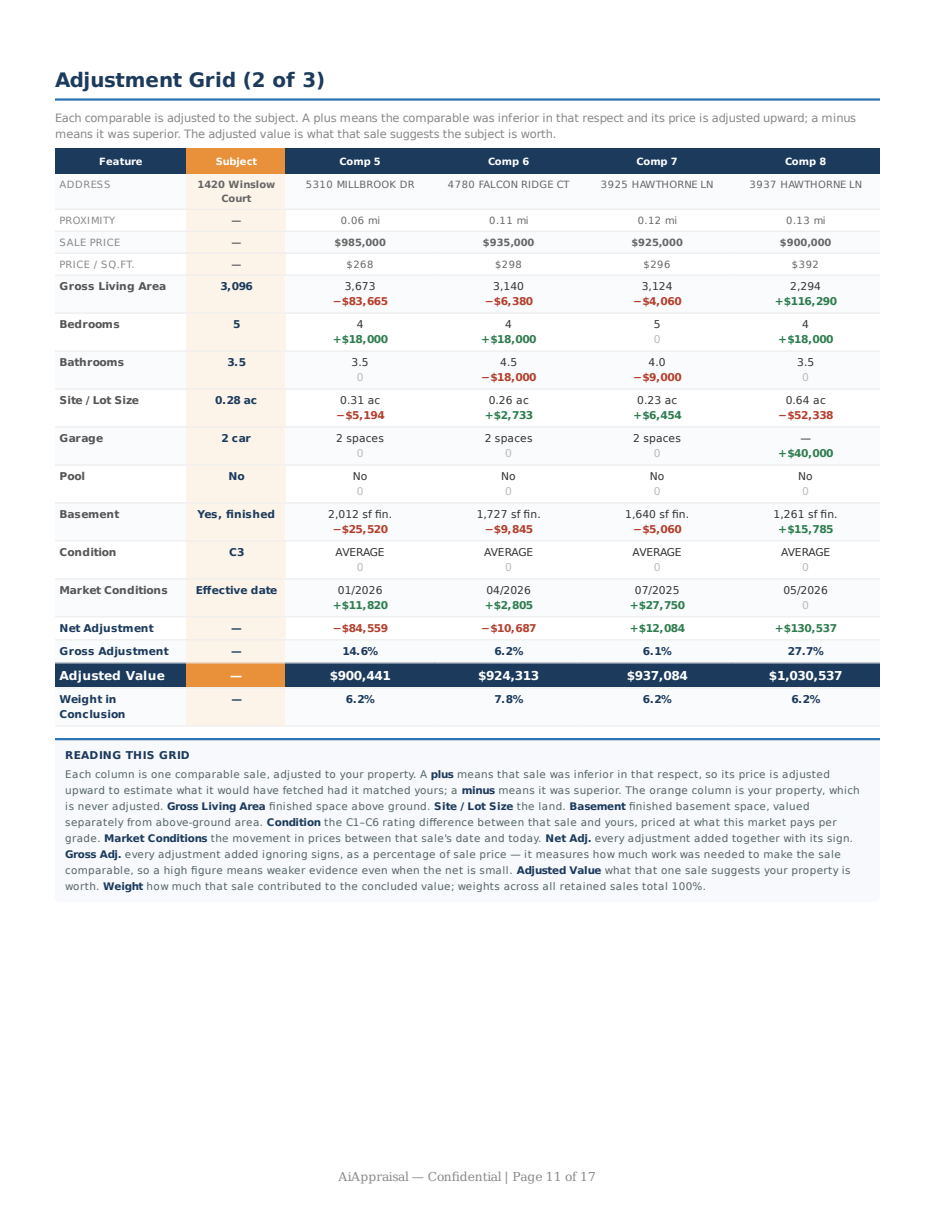
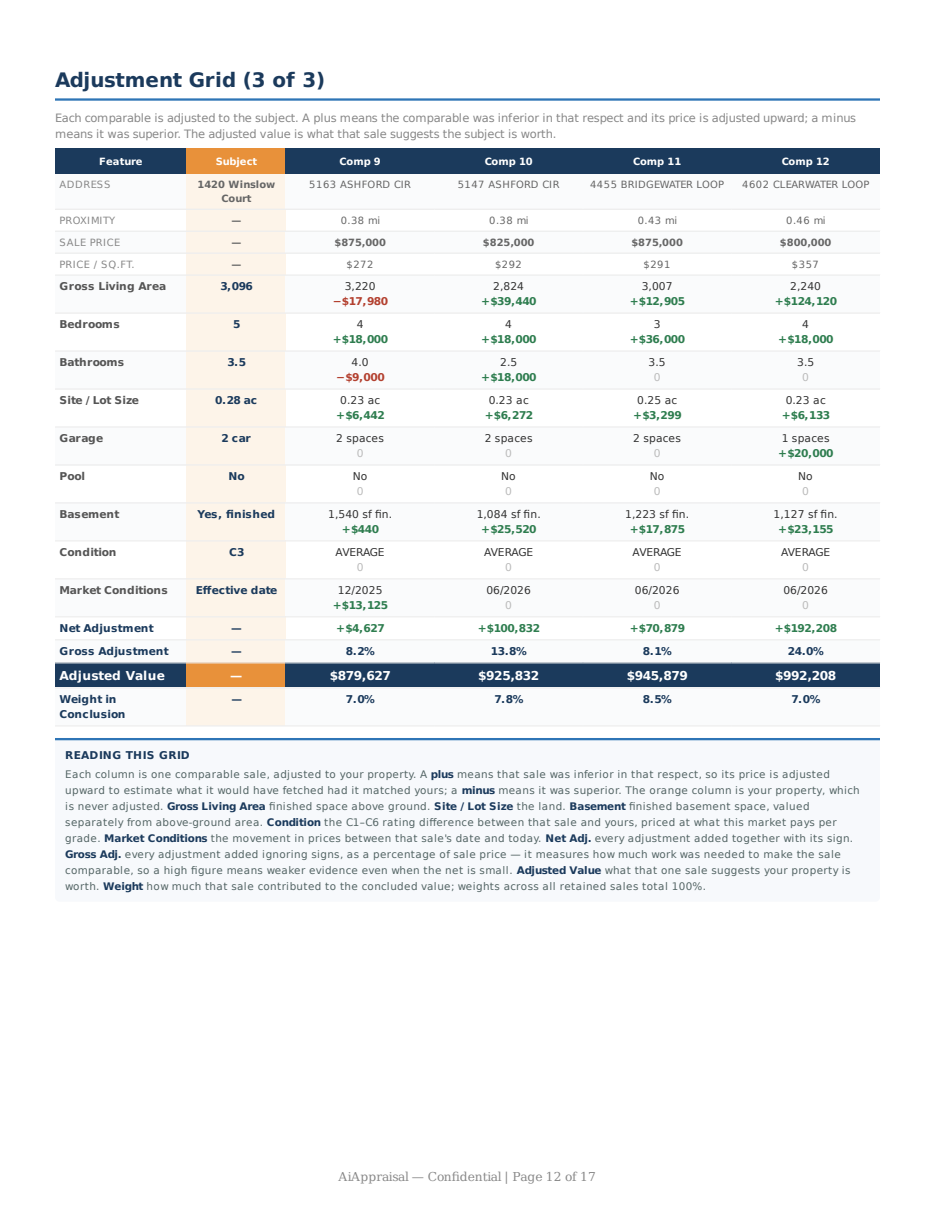
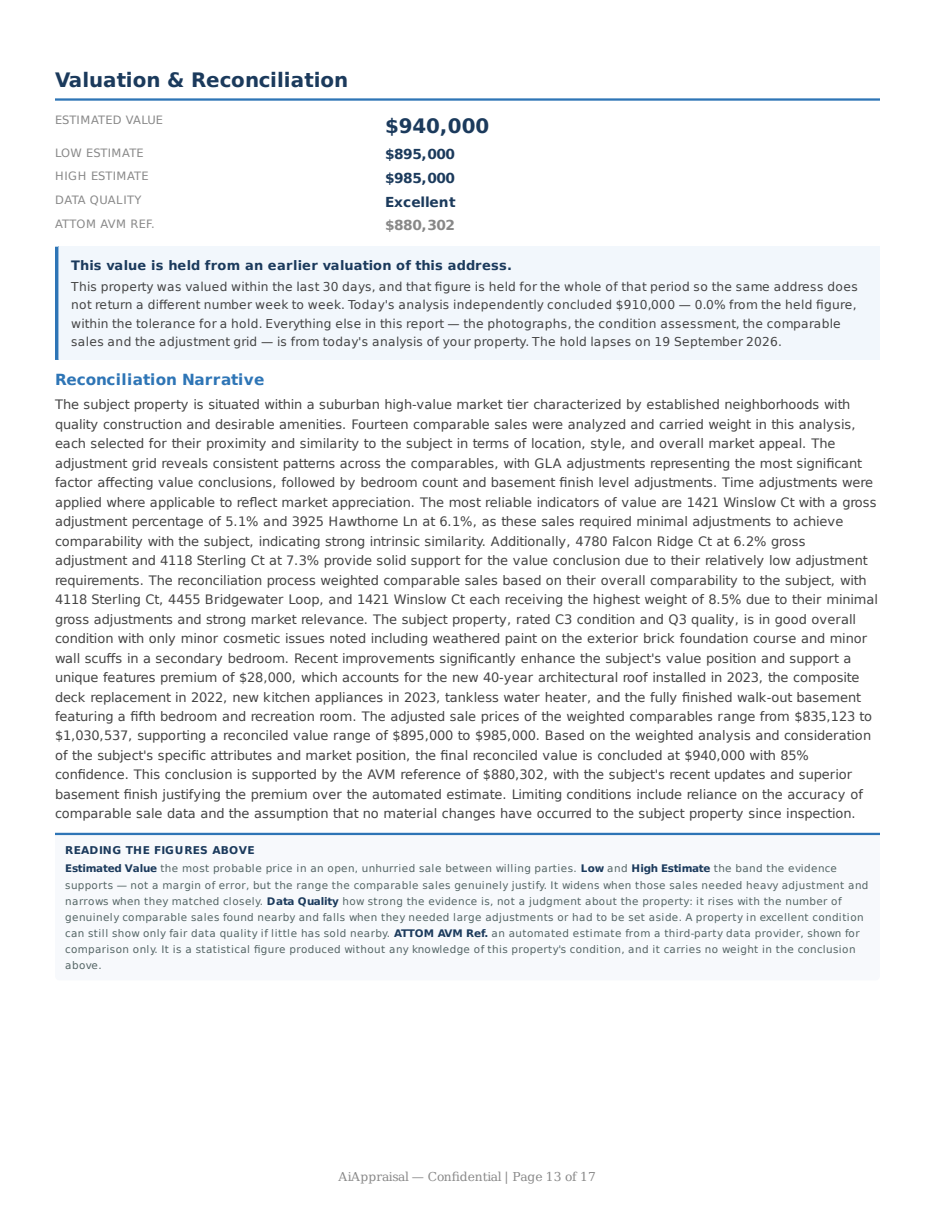



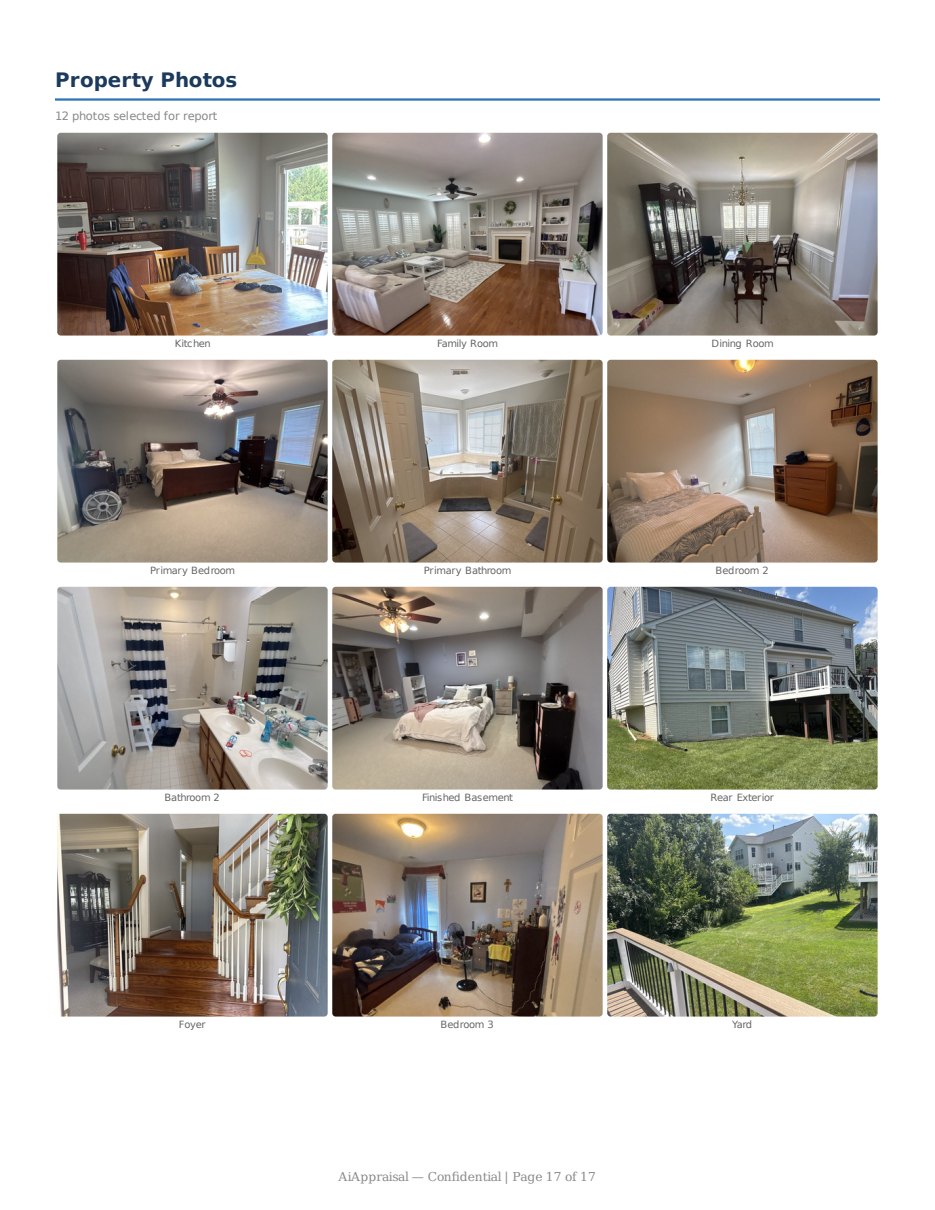
The street addresses and school names in this sample are invented and do not resolve to real properties. Everything else is genuine report output — the comparable sales analysis, the adjustments, and the photographs, which are of a real home used with the owner's permission. Your own report is built the same way from the photos you upload.
Value conclusion
The first page gives you the answer: the estimated market value, the supported range around it, and a confidence level. The range isn't decoration — it widens when the comparable sales required heavy adjustment to match your property, and narrows when they lined up cleanly.
Why it matters: a single number with no range tells you nothing about how much to trust it.
Subject property summary
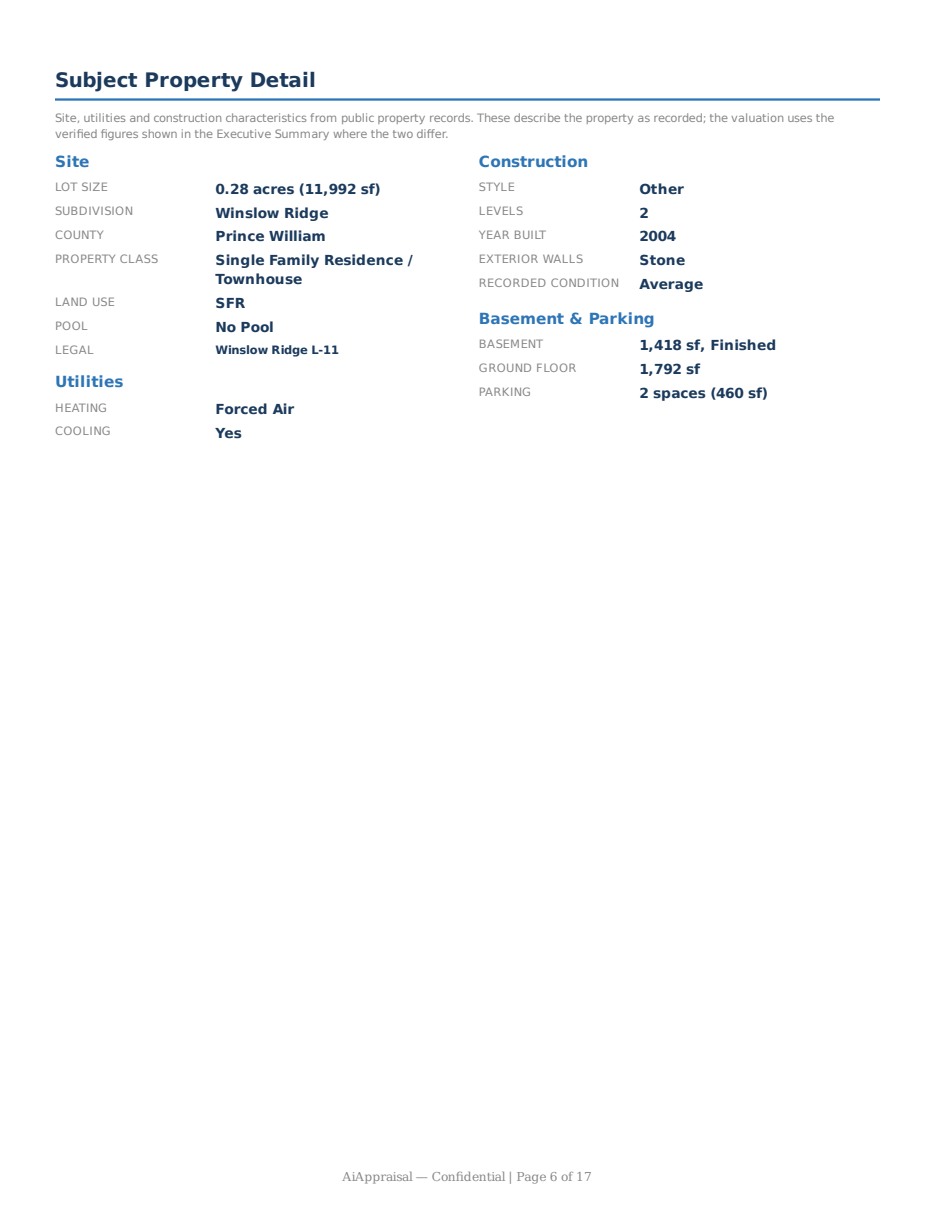
Everything we used about your property: address, living area, bedrooms and bathrooms, lot size, year built, story count, garage, and property type — along with its recorded sale history.
Why it matters: if a fact here is wrong, the value is wrong. This page lets you check the inputs before you trust the output.
Comparable sales
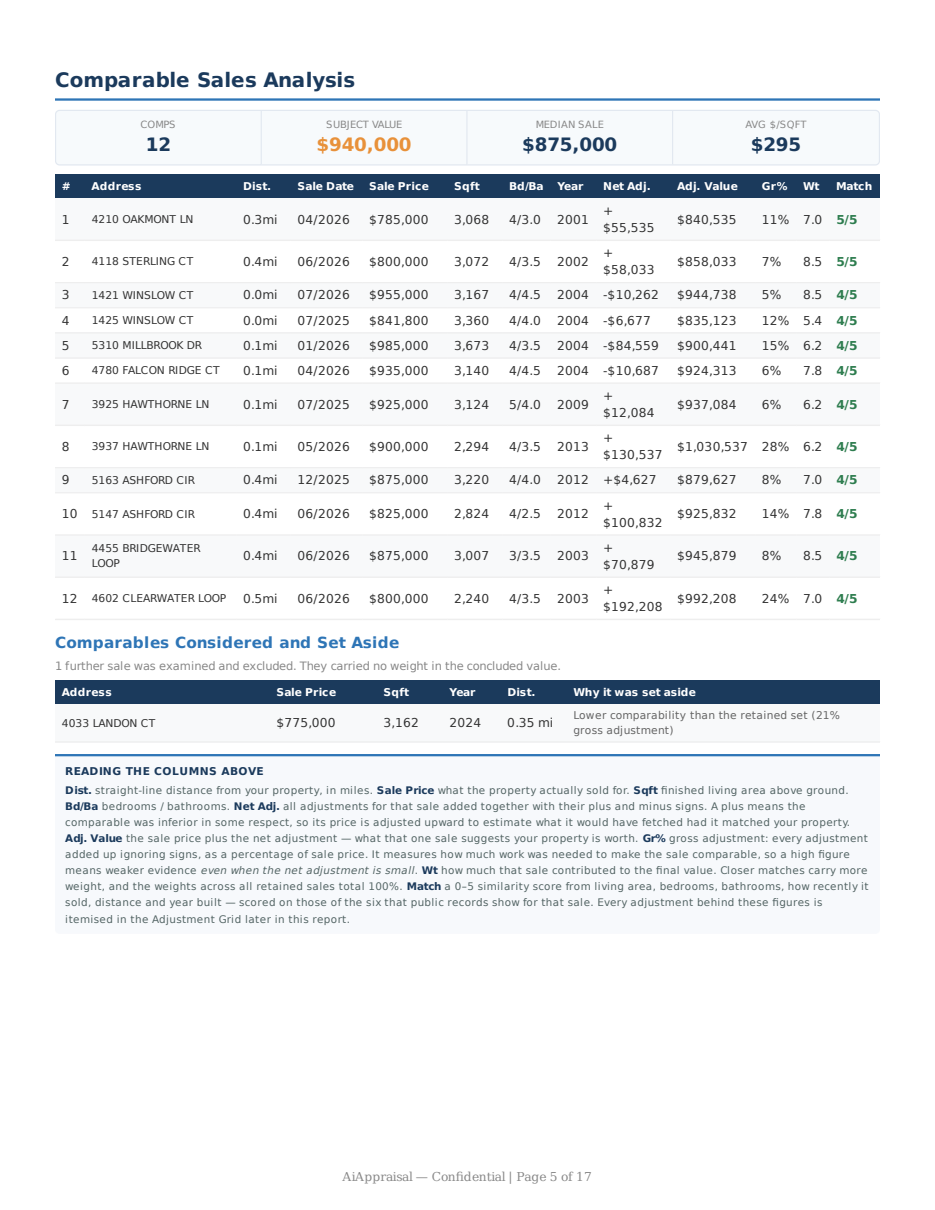
The sales we used, each with its address, sale price, sale date, distance from your property, and its own characteristics. You also see which candidates were considered and set aside, and why.
Why it matters: the comps are the valuation. If you disagree with the number, this is the page where you find out why.
Adjustment grid
The appraiser's workhorse. For each comparable: the sale price, then a line for every difference — square footage, bedrooms, bathrooms, garage, lot size, age, story count, condition, and time since sale — each with a dollar adjustment, ending in a net adjustment and an adjusted value.
Why it matters: this is what separates a real valuation from an online guess. Every dollar of the conclusion is traceable to a specific, stated reason.
Adjustment rates and how they were derived
The per-unit rates used in the grid — dollars per square foot, per bathroom, per garage bay, per year of age — and the fact that they were derived from sales in your market rather than applied from a national table.
Why it matters: an adjustment rate borrowed from the wrong market quietly corrupts every line above it.
Condition analysis
The condition grade assigned from your photos, on the standard C1–C6 scale, with the observations behind it — updated kitchen, original bathrooms, deferred exterior maintenance, and so on.
Why it matters: condition is usually the single largest adjustment, and it's the one no automated estimate can see at all.
Comparable sales map
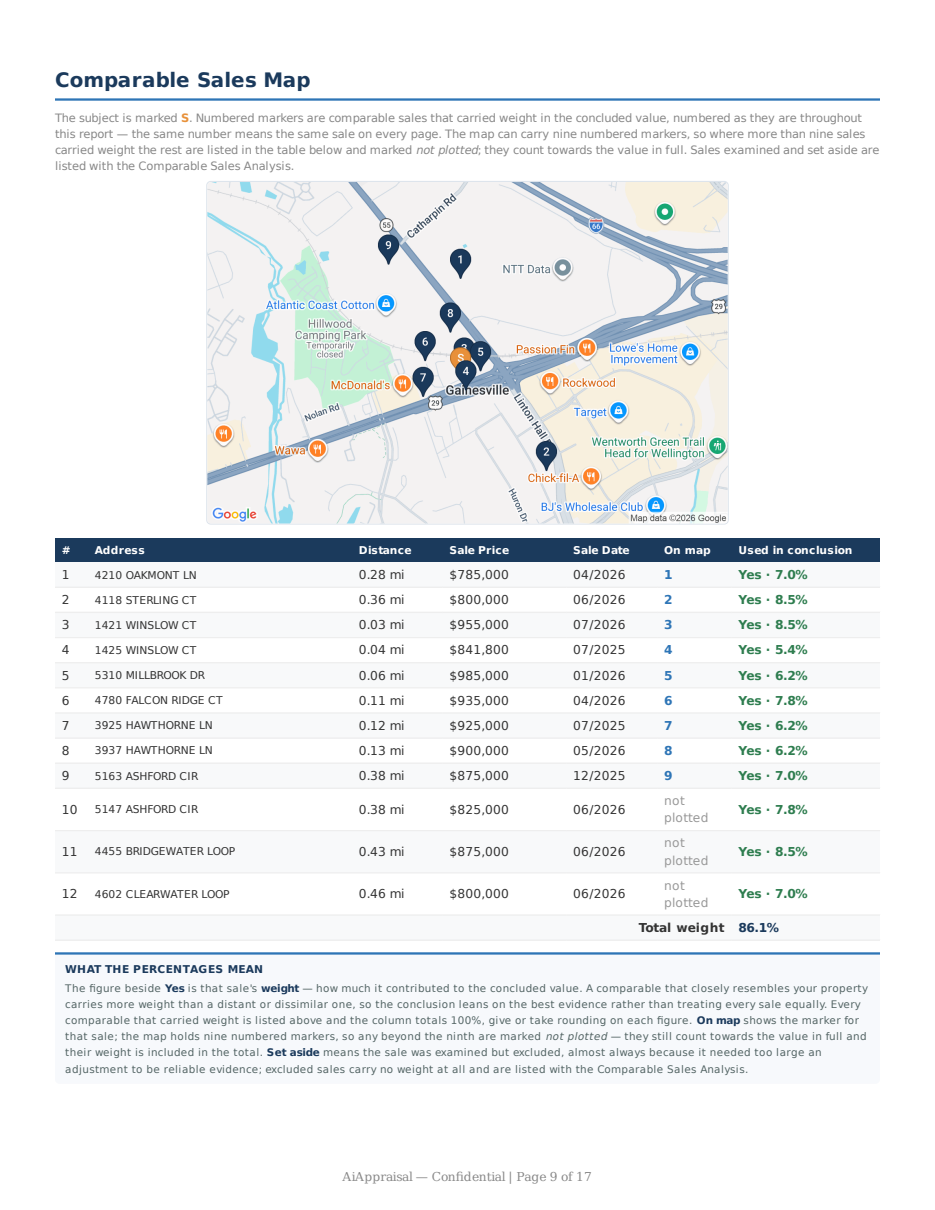
Your property and every comparable plotted together, so you can see at a glance whether the comps are genuinely in your neighborhood or reaching across a boundary that matters.
Why it matters: two houses half a mile apart can sit in different school districts and different markets.
Market and neighborhood context
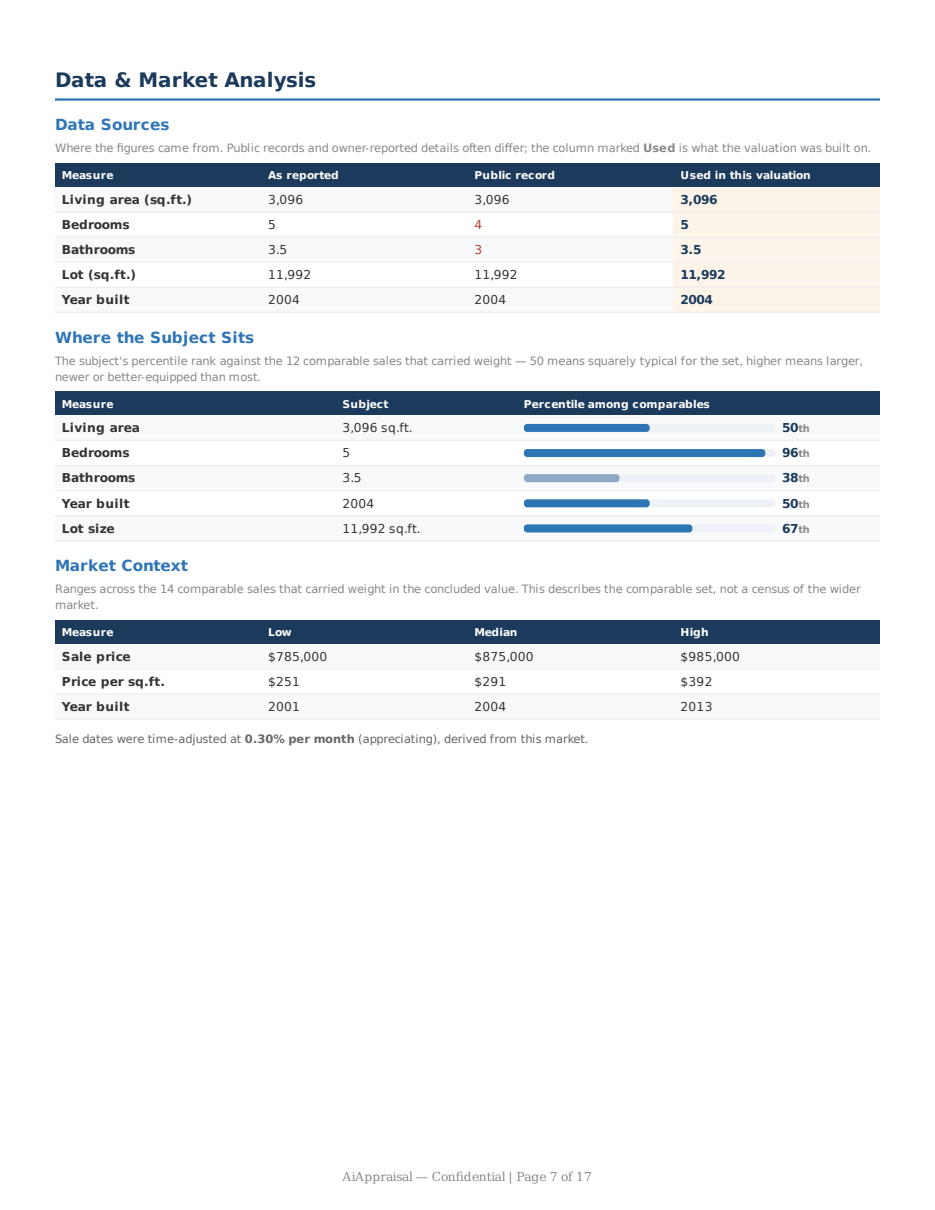
Recent price trends in the area, the time adjustment applied for market movement between each comp's sale date and today, and neighborhood characteristics.
Why it matters: a sale from ten months ago in a moving market is not evidence of today's value until it's adjusted.
Methodology and limiting conditions
A plain statement of the approach used, the data sources, the assumptions made, and the limitations — including that this is an automated valuation product rather than a USPAP-compliant appraisal.
Why it matters: anyone you hand this report to should be able to see precisely what it is and what it is not.
What you won't find in it
- A licensed appraiser's signature and certification
- Findings from an in-person interior inspection
- Anything a lender will accept for mortgage underwriting
- An opinion on repairs, code compliance, or structural condition